Behind the Curtain
How the work in these collections actually gets made.
Three collections sit on this site. A set of artwork, a recovered field archive, and a pair of botanical briefing books. They have almost nothing in common on the surface.
What they share is that a person directed each one and an AI engine did substantial work inside it. What differs, and differs enormously, is where the line between those two falls.
This page is about that line. It is written for the reader who wants to know what was actually done, and by whom, before deciding what any of it is worth.
Objective: Show the working. Where a person directed, where an engine ran, and what each collection demanded that the other two did not.
Three divisions of labour
The three collections were built in three different ways. Read in the order they were made, they are a sequence rather than a set. Each one hands more of the middle to the engine and keeps both ends.
The Gallery works step by step. Several engines contribute to a single image, chosen for what each is good at. Every element goes through multiple rounds of human and AI interaction, and the person looks at the result before asking for the next thing. The finishing is done by hand in Photoshop with a tablet. Nothing advances unseen.
The Jones Collection works as a pipeline. Thirteen hundred pages of degraded scans go in one end. A vision-language model extracts the text and an AI engine interprets it, correcting errors, resolving twenty-one variant spellings of a single bay name, and reassembling tables broken across pages. The person is at both ends of the run rather than inside every page. That is the only way thirteen hundred pages get done at all.
The Briefing Books are orchestrated. From a coordinate and one page of site knowledge, the engine runs the entire dependent chain and hands back a bound document. There is no person in the middle.
The third of those is the newest and the one worth examining closely, because it makes the largest claim.
The input contract
A claim that a small input produces a fourteen page document is easy to make and easy to inflate. So here is the entire input for one of the books.
The ʻIliau Loop Trail sits on the rim of Waimea Canyon on Kauaʻi. The briefing book for that site runs fourteen pages across seven reports, with figures, a master checklist, conservation flags, an elevation analysis, and a one page field card. Two things went in. A coordinate, and the file below. The standing instruction that governs how any of these books gets built is shown further down, and it is the same for every site. There was no outline, no list of figures, and no instruction about which species mattered.
# ʻIliau Loop Trail — site preview (the collector's "why go")
_Captured 2026-07-17 from Kim's preview observations, BEFORE building the briefing materials. Method: the reason for going is a front-and-center INPUT to the briefing — we don't visit arbitrary places. Not exclusive of later observations once the materials are seen. This is the "direction" complement to the 80%-tool "correction"._

## Location & access
On the road from sea level (Kauaʻi coast) up to the Alakaʻi Plateau rainforests (Waimea Canyon Rd / Kokeʻe Rd, Hwy 550). The Waimea River cuts a deep channel; the highway often runs very close to a precipitous drop to the canyon floor. The ʻIliau Loop Trail sits BETWEEN the highway and the steep drop-off. ACCESS PROBLEM: almost no parking; not obvious at highway speed where to stop; navigation is not easy.

## The confusion hazard — elevation as the key (technical hook)
A hard-to-locate trailhead is a plausible reason pre-GPS voucher locations were placed inaccurately => expect a WORSE georeferencing story than Kīpuka (R1). Locations that appear "nearby" but are down on the CANYON FLOOR do not relate to the rim site — a real source of confusion in the records. **ELEVATION is the discriminator:** the loop trail is on the rim; canyon-floor collections sit far lower. Extract elevation at each record and separate/flag rim vs canyon-floor. (New site-specific lens; Kīpuka's gentle terrain didn't need it. Generalizes to any steep-terrain site.)

## Significance — why this site matters (the name tells it)
ʻiliau = **Wilkesia gymnoxiphium**, a relative of the SILVERSWORDS — the textbook Hawaiian adaptive-radiation example (the silversword alliance: Argyroxiphium / Dubautia / Wilkesia). Kauaʻi-endemic; scarce even here (ʻiliau occur outside the loop-trail area but are fairly scarce). Besides ʻiliau, several very interesting species NOT found at other nearby sites — the collecting draw. => a "SITE-DISTINCTIVE TAXA" angle for the targets report (what does this site hold that its neighbours don't?).

## Cultural signal
Old Hawaiian activity: huge, likely very old TĪ plants (Cordyline fruticosa), probably PLANTED (tī was useful to older Hawaiian society). An anthropogenic / ethnobotanical note — the flora here carries human history.
That is the working file as it was written, with the line breaks reflowed to fit this page. A closing section of build notes, which maps each observation onto a report number, has been left off because the report numbers mean nothing outside the project.
Follow four of those sentences into the finished book.
The parking problem became the access paragraph and drove the choice of landmarks on the cover map. The elevation observation reorganized the entire georeferencing analysis, because it turned a vague worry about bad coordinates into a testable split between rim collections and canyon floor collections. The silversword note put significance on the first page instead of burying it in a species table. The old tī plants became an ethnobotanical note in the site description.
None of those four is in any database. That is the whole point. The preview is short and it carries enormous leverage precisely because it contains the things a person knows from having stood there.
It is worth saying what the preview is not. It is not a specification. It does not say what the figures should be, how the tables should look, or what order anything goes in. It says why the place matters and what to watch out for. The engine decided the rest.
The chain
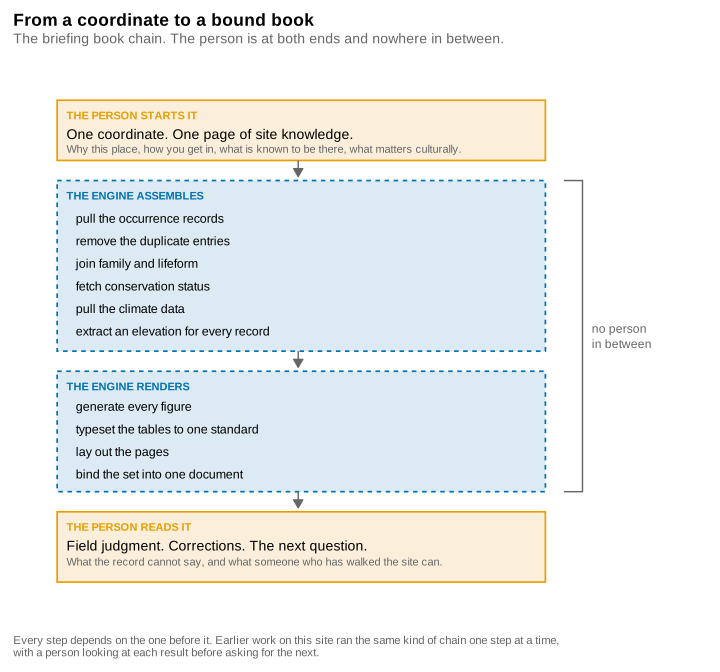
Every step in the two middle boxes depends on the one above it. An elevation cannot be extracted from a record that has not been pulled, deduplicated and joined to a taxonomy. A figure cannot be generated from a table that has not been assembled. A book cannot be bound from pages that have not been laid out.
Earlier work on this site ran the same kind of chain one step at a time, with a person looking at each intermediate result before asking for the next. That is safer and it is much slower. Running the chain end to end is the demonstration. It is also the thing that makes the two remaining human stages matter more, not less, because there is no longer an inspection point in the middle to catch a bad assumption early.
What the engine is doing here is assembly, not adjudication. It decides how to organize an analysis. It does not decide what is true about a place. Where it produced something nobody asked for, and where that turned out to be both valuable and occasionally wrong, is described on The Briefing Books page.
What it is made of
The fair question from anyone who wants to do this is what it would take to run a new site.
The chain is not one program. It is assembled from R packages, most of them written for earlier projects and pressed into service here.
The occurrence layer is checklistr. It pulls preserved-specimen records from GBIF for a point and a radius, removes duplicates, joins family and lifeform, attaches conservation status, detects determination conflicts between duplicate sheets held at different institutions, and produces the collector and species-discovery analytics. It was written to compare the floras of different places, which is why it asks for a coordinate and a radius rather than a place name. Its author field lists a person and an AI engine jointly, which is accurate.
Three more packages fill in around it. vouchr derives terrain and substrate from the coordinate for the site-factors report. whittakerr places the site on a Whittaker biome diagram using WorldClim data. elevatr returns an elevation for every individual record, and that is the piece that made the rim and canyon-floor separation possible at all. Without a per-record elevation the ʻIliau analysis would have been a list of records at a radius, which is exactly the wrong answer for that site.
Every basemap uses Esri topographic tiles. That is not a preference. OpenStreetMap tiles come back blank at these coordinates.
So starting a new site takes two things. The first is a written instruction naming those packages, the reports wanted, and the standard the whole set holds to. That instruction is close to boilerplate. It barely changes between sites, and it is reproduced in full below. The second thing is the site preview.
Only one of those two can be written by someone who has not been there.
The standing instruction
For the first two books this instruction was not a document. It was context carried inside a working session, which is fine while the session lasts and useless afterwards. It has since been written down, which is what makes it possible to hand the whole thing over rather than rebuild it from memory.
Build a briefing book for [SITE NAME], centre [lat] / [lon], on the Kīpuka Puaulu and ʻIliau Loop Trail model.

Occurrence layer: checklistr — fetch_specimens_gbif, dedup_specimens, add_lifeform, add_status / status_gift, detect_det_conflicts, map_specimens, plot_collector_activity, plot_species_discovery, collector_profile, richness_estimate. Terrain and substrate: vouchr::site_extract. Climate: whittakerr against WorldClim. Per-record elevation: elevatr. Conservation status: IUCN via GBIF, plus GIFT for growth form.

Every basemap uses Esri topo tiles. OSM tiles return blank at these sites.

Emit the reports that this site actually warrants, from the report catalog. Both existing books carry R1 (the place at several scopes), R2 (the annotated checklist), R3+R4 (targets), R5 (contested identities), R7 (climate and site factors), R10 (collecting history), and the one-page field card. Bind with qpdf.

House standard, non-negotiable. Type in ggplot size units: report title 6.4 bold, section and figure titles 5.6 to 6.0, subtitle 3.4, body and notes 3.3 to 3.5 with strwrap at width 100 to 104 and clip = "off", tables base 11 to 12, figure axis text 11 to 13, axis titles 17 to 19. Footer text is wrapped, never broken by hand. Okabe-Ito palette (blue #0072B2, orange #E69F00, grey #666666). Nothing is ever carried by colour alone. One figure per page width, stacked, never side by side.

Honesty rules that override any cleaner-looking output. Staleness is a gap in collecting effort, not evidence of rarity. Coordinate precision is not locatability, so every target gets one of three tiers: relocatable, search the vicinity, or general area only. The record is not the flora, so each master list carries a note on what is probably present but unrecorded.

Naming: Kīpuka Puaulu is never shortened. Preserve every ʻokina and macron.

My site preview follows. It directs the analysis. Adapt the reports to it rather than filling a template with it.

[paste site_preview.md here]
That is an instruction to a person and an engine working together. It is not a script and it does not run on its own.
Read it next to the site preview above and the division of labour is visible in the two documents themselves. The instruction is technical, transferable, and true of every site. The preview is specific, personal, and true of exactly one place. The first one gets easier to write every year. The second one still requires standing on the rim of Waimea Canyon and noticing that the tī plants are far too big and far too well placed to have arrived on their own.
The constraints that shaped the form
Everything here was produced on one desktop machine, and the limits of that machine shaped the results more than any design meeting would have.
One language. The connection that lets an engine work on this machine runs R and does not run shell commands. Anything that could not be expressed in R did not get built. That sounds like a handicap and largely was not. It forced the whole pipeline into a single language, which means there is one place to look when a number is wrong, and a reader who knows R can follow the build from the query to the bound page.
Print, not scroll. The briefing books are PDFs because they are meant to be printed and carried. A fixed page is a real constraint. Everything has to fit somewhere, tables cannot expand indefinitely, and a figure that needs a caption to be understood has already failed. Choosing the harder format early prevented a lot of loose work later.
No retroactive improvement. The Gallery pieces are dated and left alone. When better tools arrive, the earlier work is not quietly reprocessed. An image made in 2024 keeps whatever the 2024 tools could and could not do, including the flaws. That makes the collection usable as a record of how fast this is moving, which a continuously polished collection could not be.
The working data ships with the conclusions. Each briefing book publishes the tables it was built from, exported as they stood when the book was bound. A reader who doubts a number can open the file and check it. This is cheap to do and it is the difference between a document that asks to be believed and one that can be argued with.
What stays human
Direction stays human. There are no blank slate requests anywhere in these three collections. Somebody chose the site, the subject, the archive and the question.
Judgment stays human. The engine will produce an observation nobody asked for, and it will produce it at exactly the same fluency whether the observation is a real discovery or an impossibility. Reading which is which requires knowing the subject.
There is a 1989 essay by Jared Diamond in Natural History called “The Ethnobiologist’s Dilemma.” Its paradox is that a researcher has to already know the local plants and animals well in order to get anything useful from interviewing the people who know them best. Without that knowledge you cannot ask the right question, and you cannot recognize the right answer when you get it.
The same paradox holds here. A tool that does eighty percent of a task hands the remaining twenty percent back to whoever is holding it. If that person cannot tell a genuine pattern from a confident error, the tool produces a well formatted document that is wrong throughout, with no error message anywhere. Better engines do not dissolve that problem. They raise the value of knowing the site.